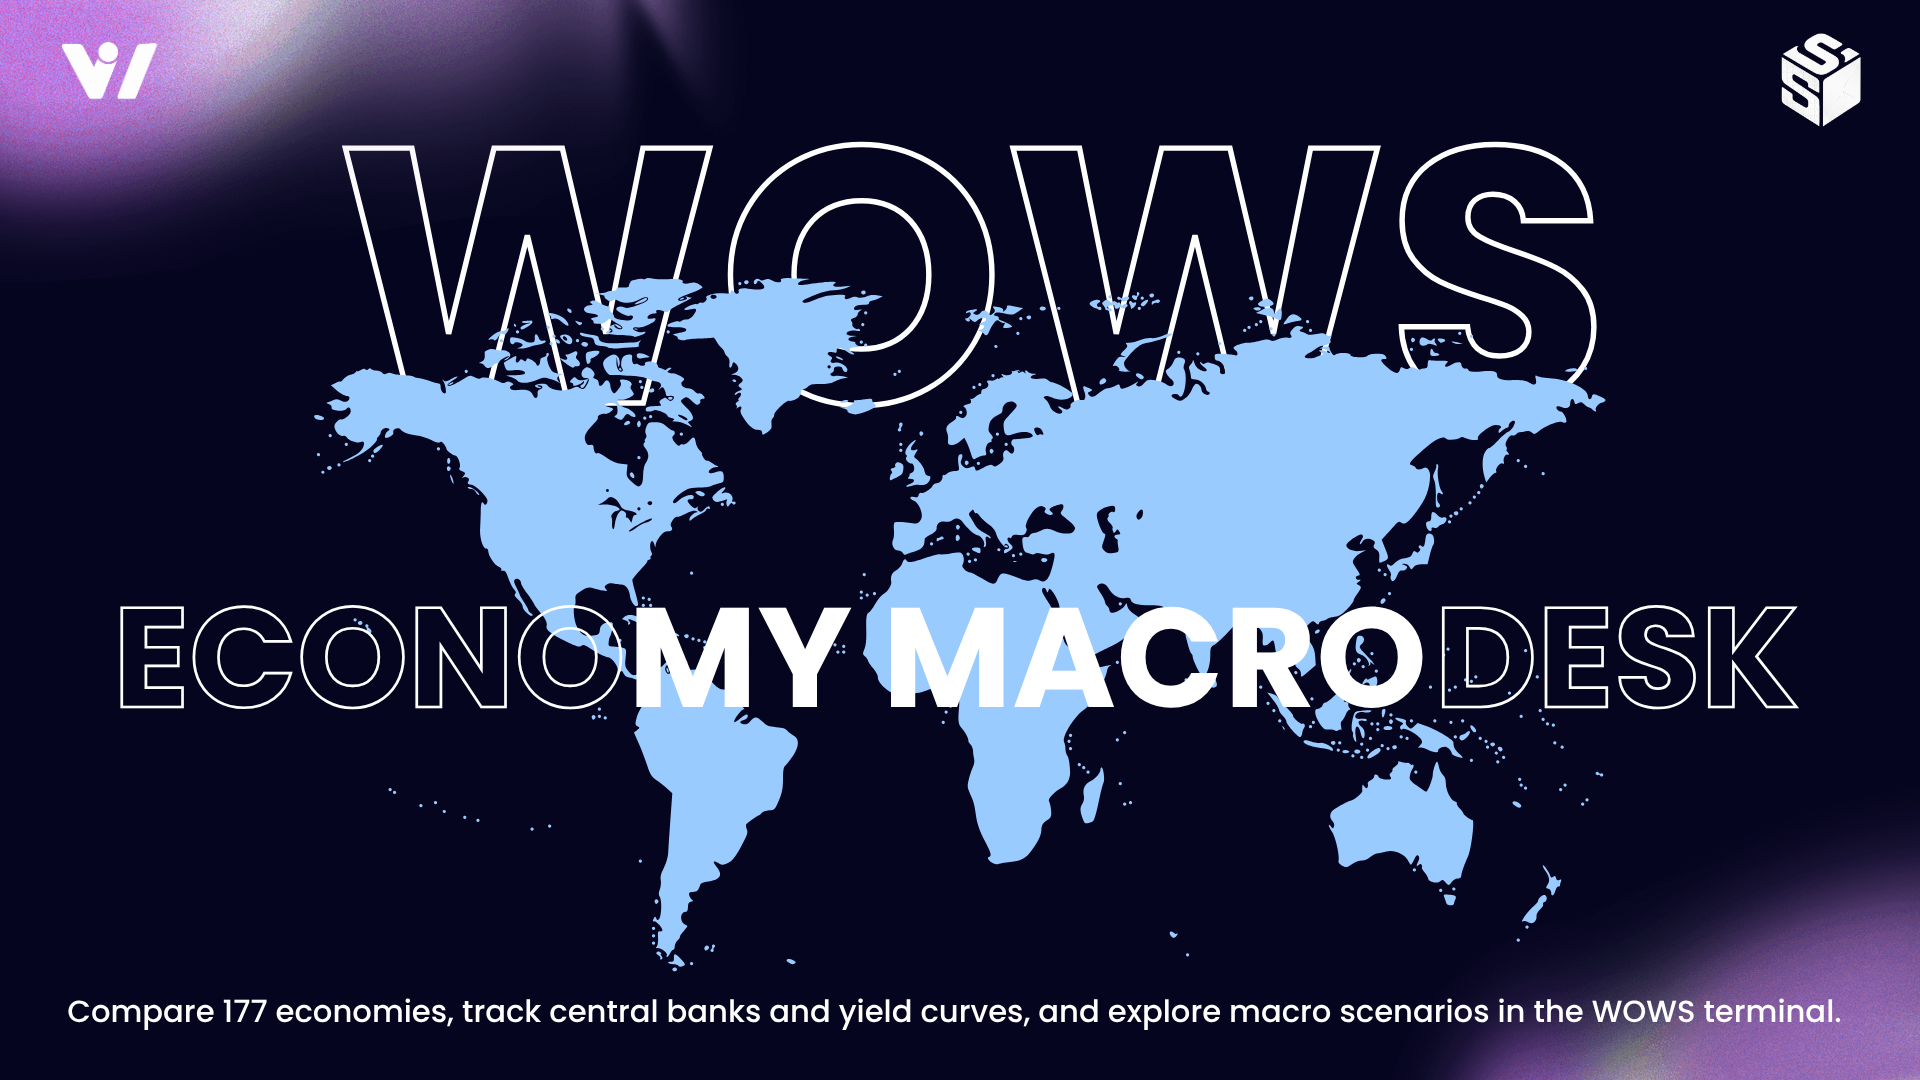
Markets don't move in isolation. Now, the economic forces behind them have a place inside WOWS.
A chart shows price. A watchlist tracks movement. A news feed tells you what happened.
But understanding why markets move often requires looking at something much bigger: the global economy.
Central bank decisions influence interest rates. Inflation changes the direction of monetary policy. Sovereign bond yields reflect shifting expectations. And a disruption in one part of the world can travel through currencies, commodities, capital flows, and equity markets.
These relationships are easy to overlook when the information is scattered across multiple platforms.
The WOWS World Macro Desk brings that bigger picture into the same browser-based terminal used to explore markets, analyze charts, monitor assets, and practice trading.
With a coverage universe spanning 177 sovereign entities and 39 tracked central banks, the new workspace expands WOWS beyond individual securities and into the economic systems that connect them.
More than another macro dashboard
Most economic dashboards stop at displaying numbers.
GDP growth. Inflation. Unemployment. Policy rates.
Useful information, but numbers become more meaningful when they can be compared, explored, and connected to one another.
The World Macro Desk brings eight dedicated workspaces together under one interface.
ECOW — Sovereign Matrix
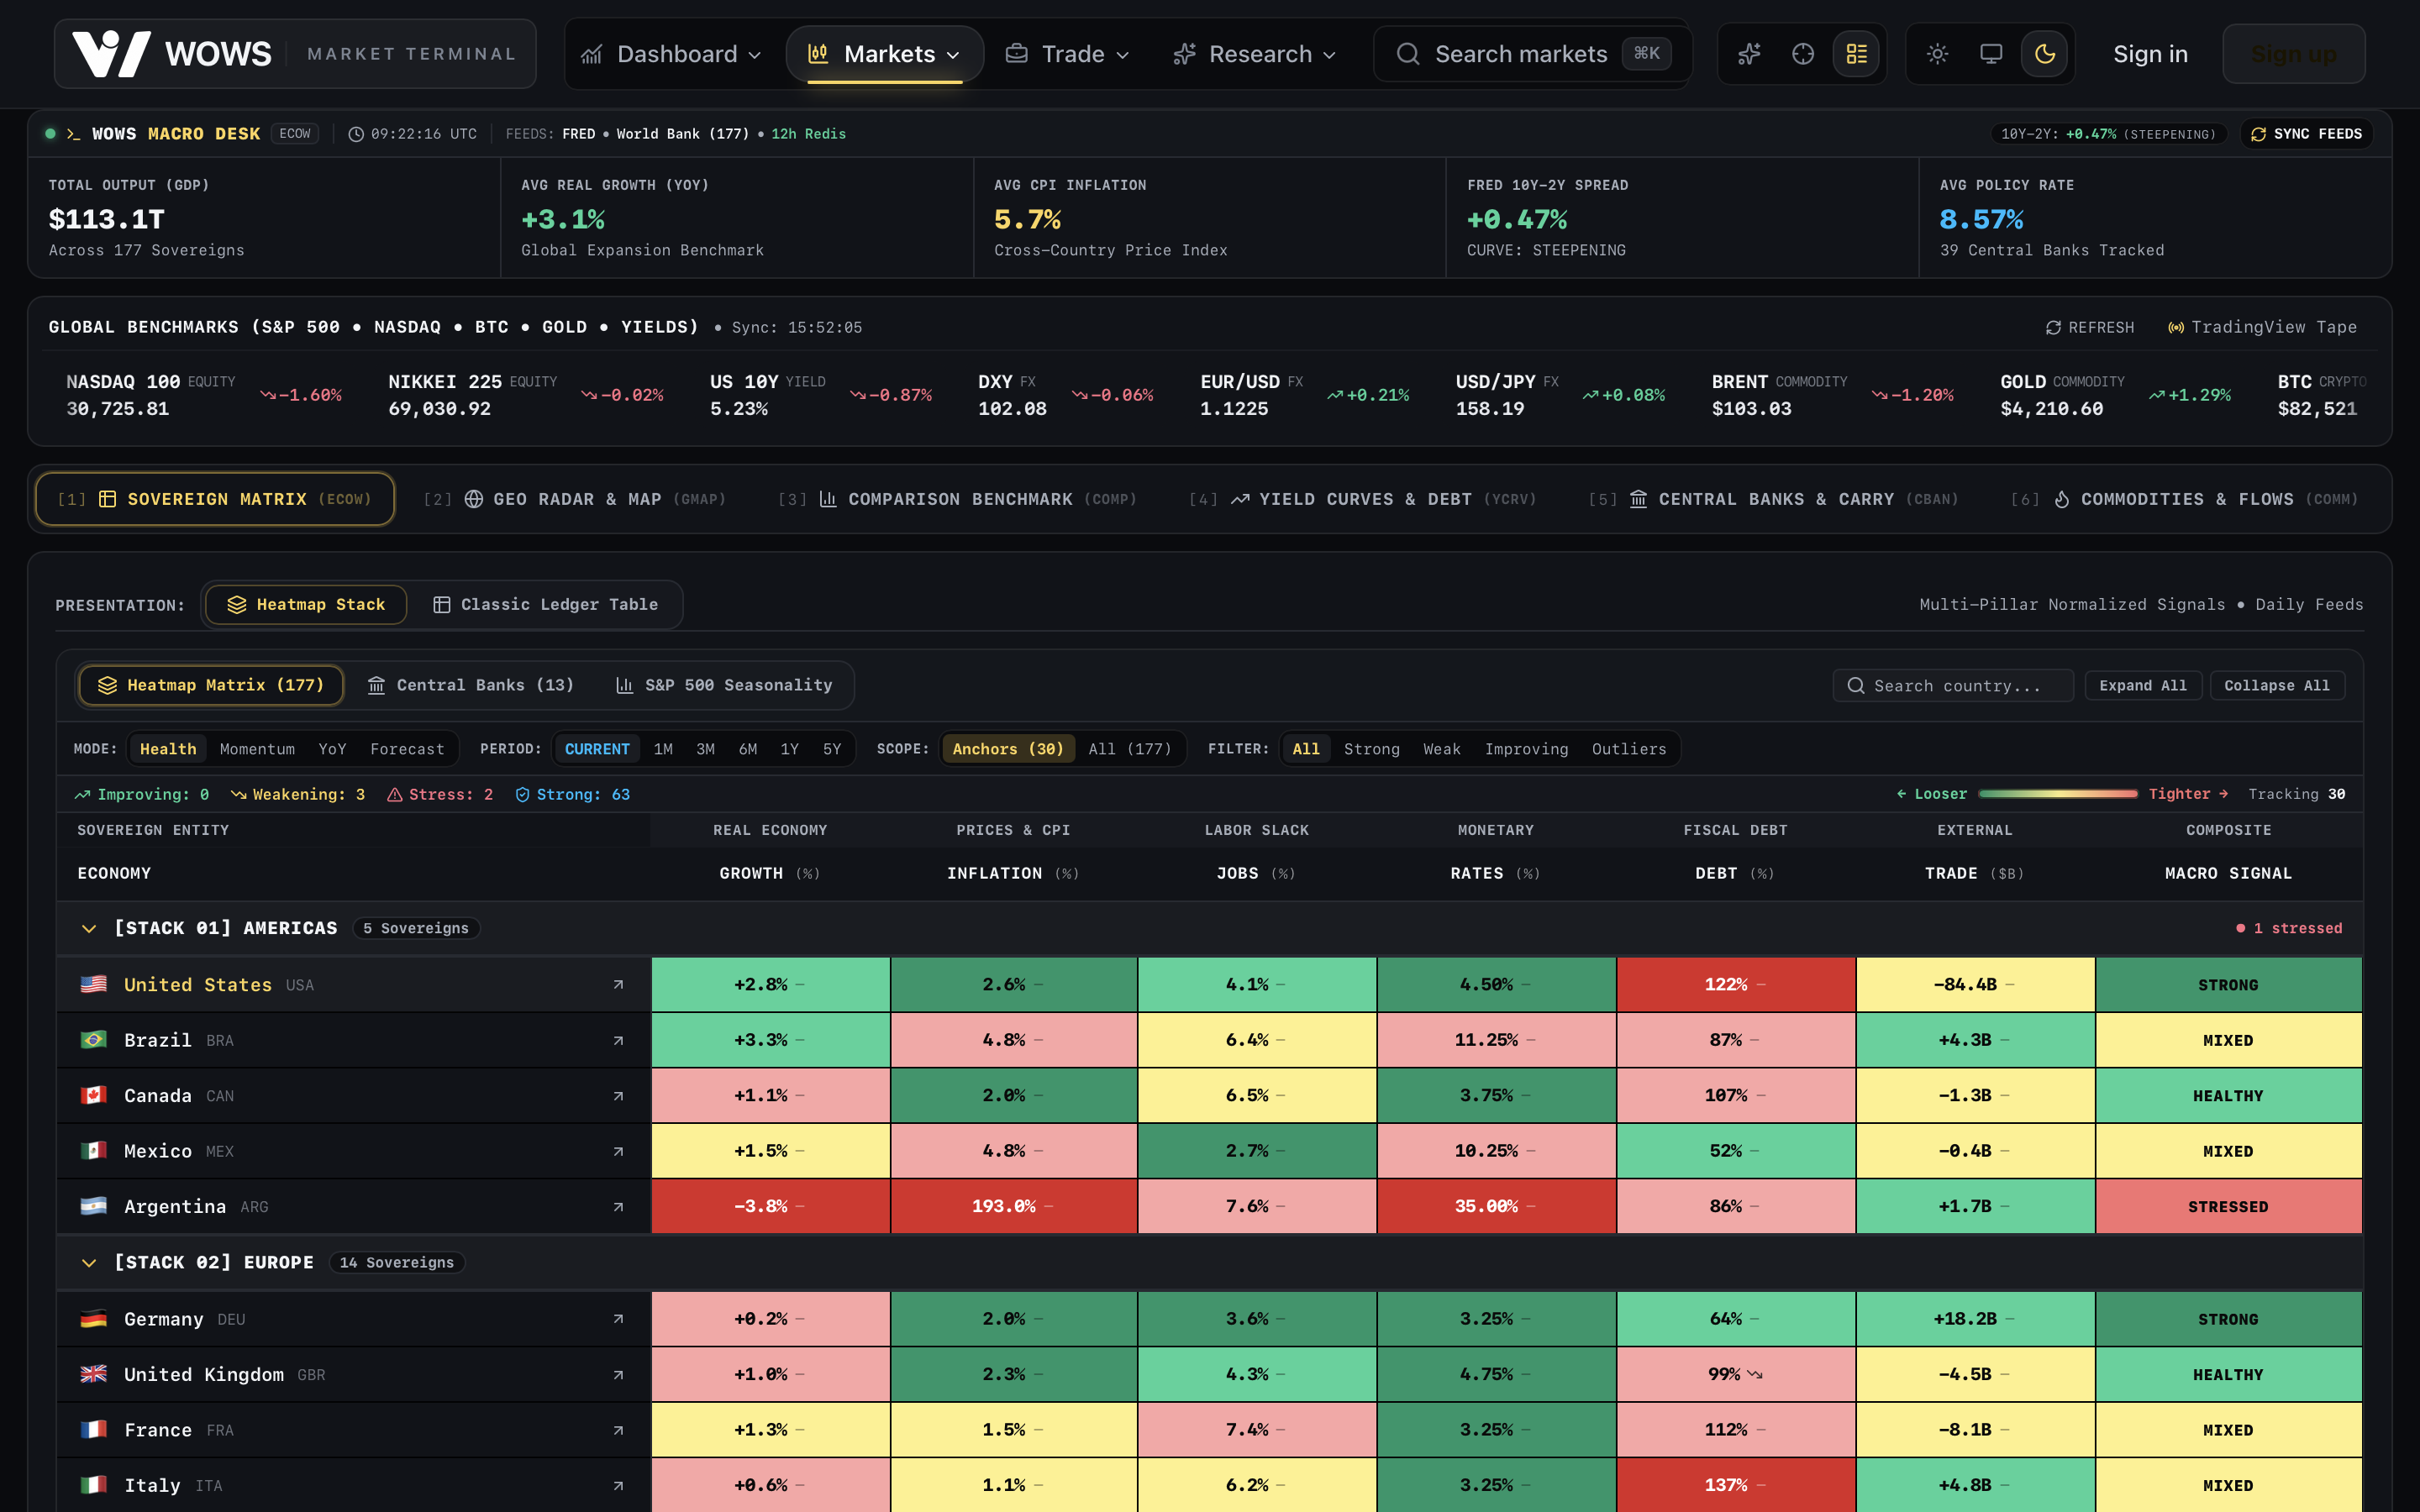
Compare economic conditions across countries and regions using a structured macroeconomic matrix.
Switch between a multi-pillar heatmap and a traditional ledger table, explore regional groupings, filter for stronger or weaker conditions, and examine indicators across different time horizons.
The goal is to make differences between economies easier to see without manually assembling the data yourself.
GMAP — Geo Radar & Map
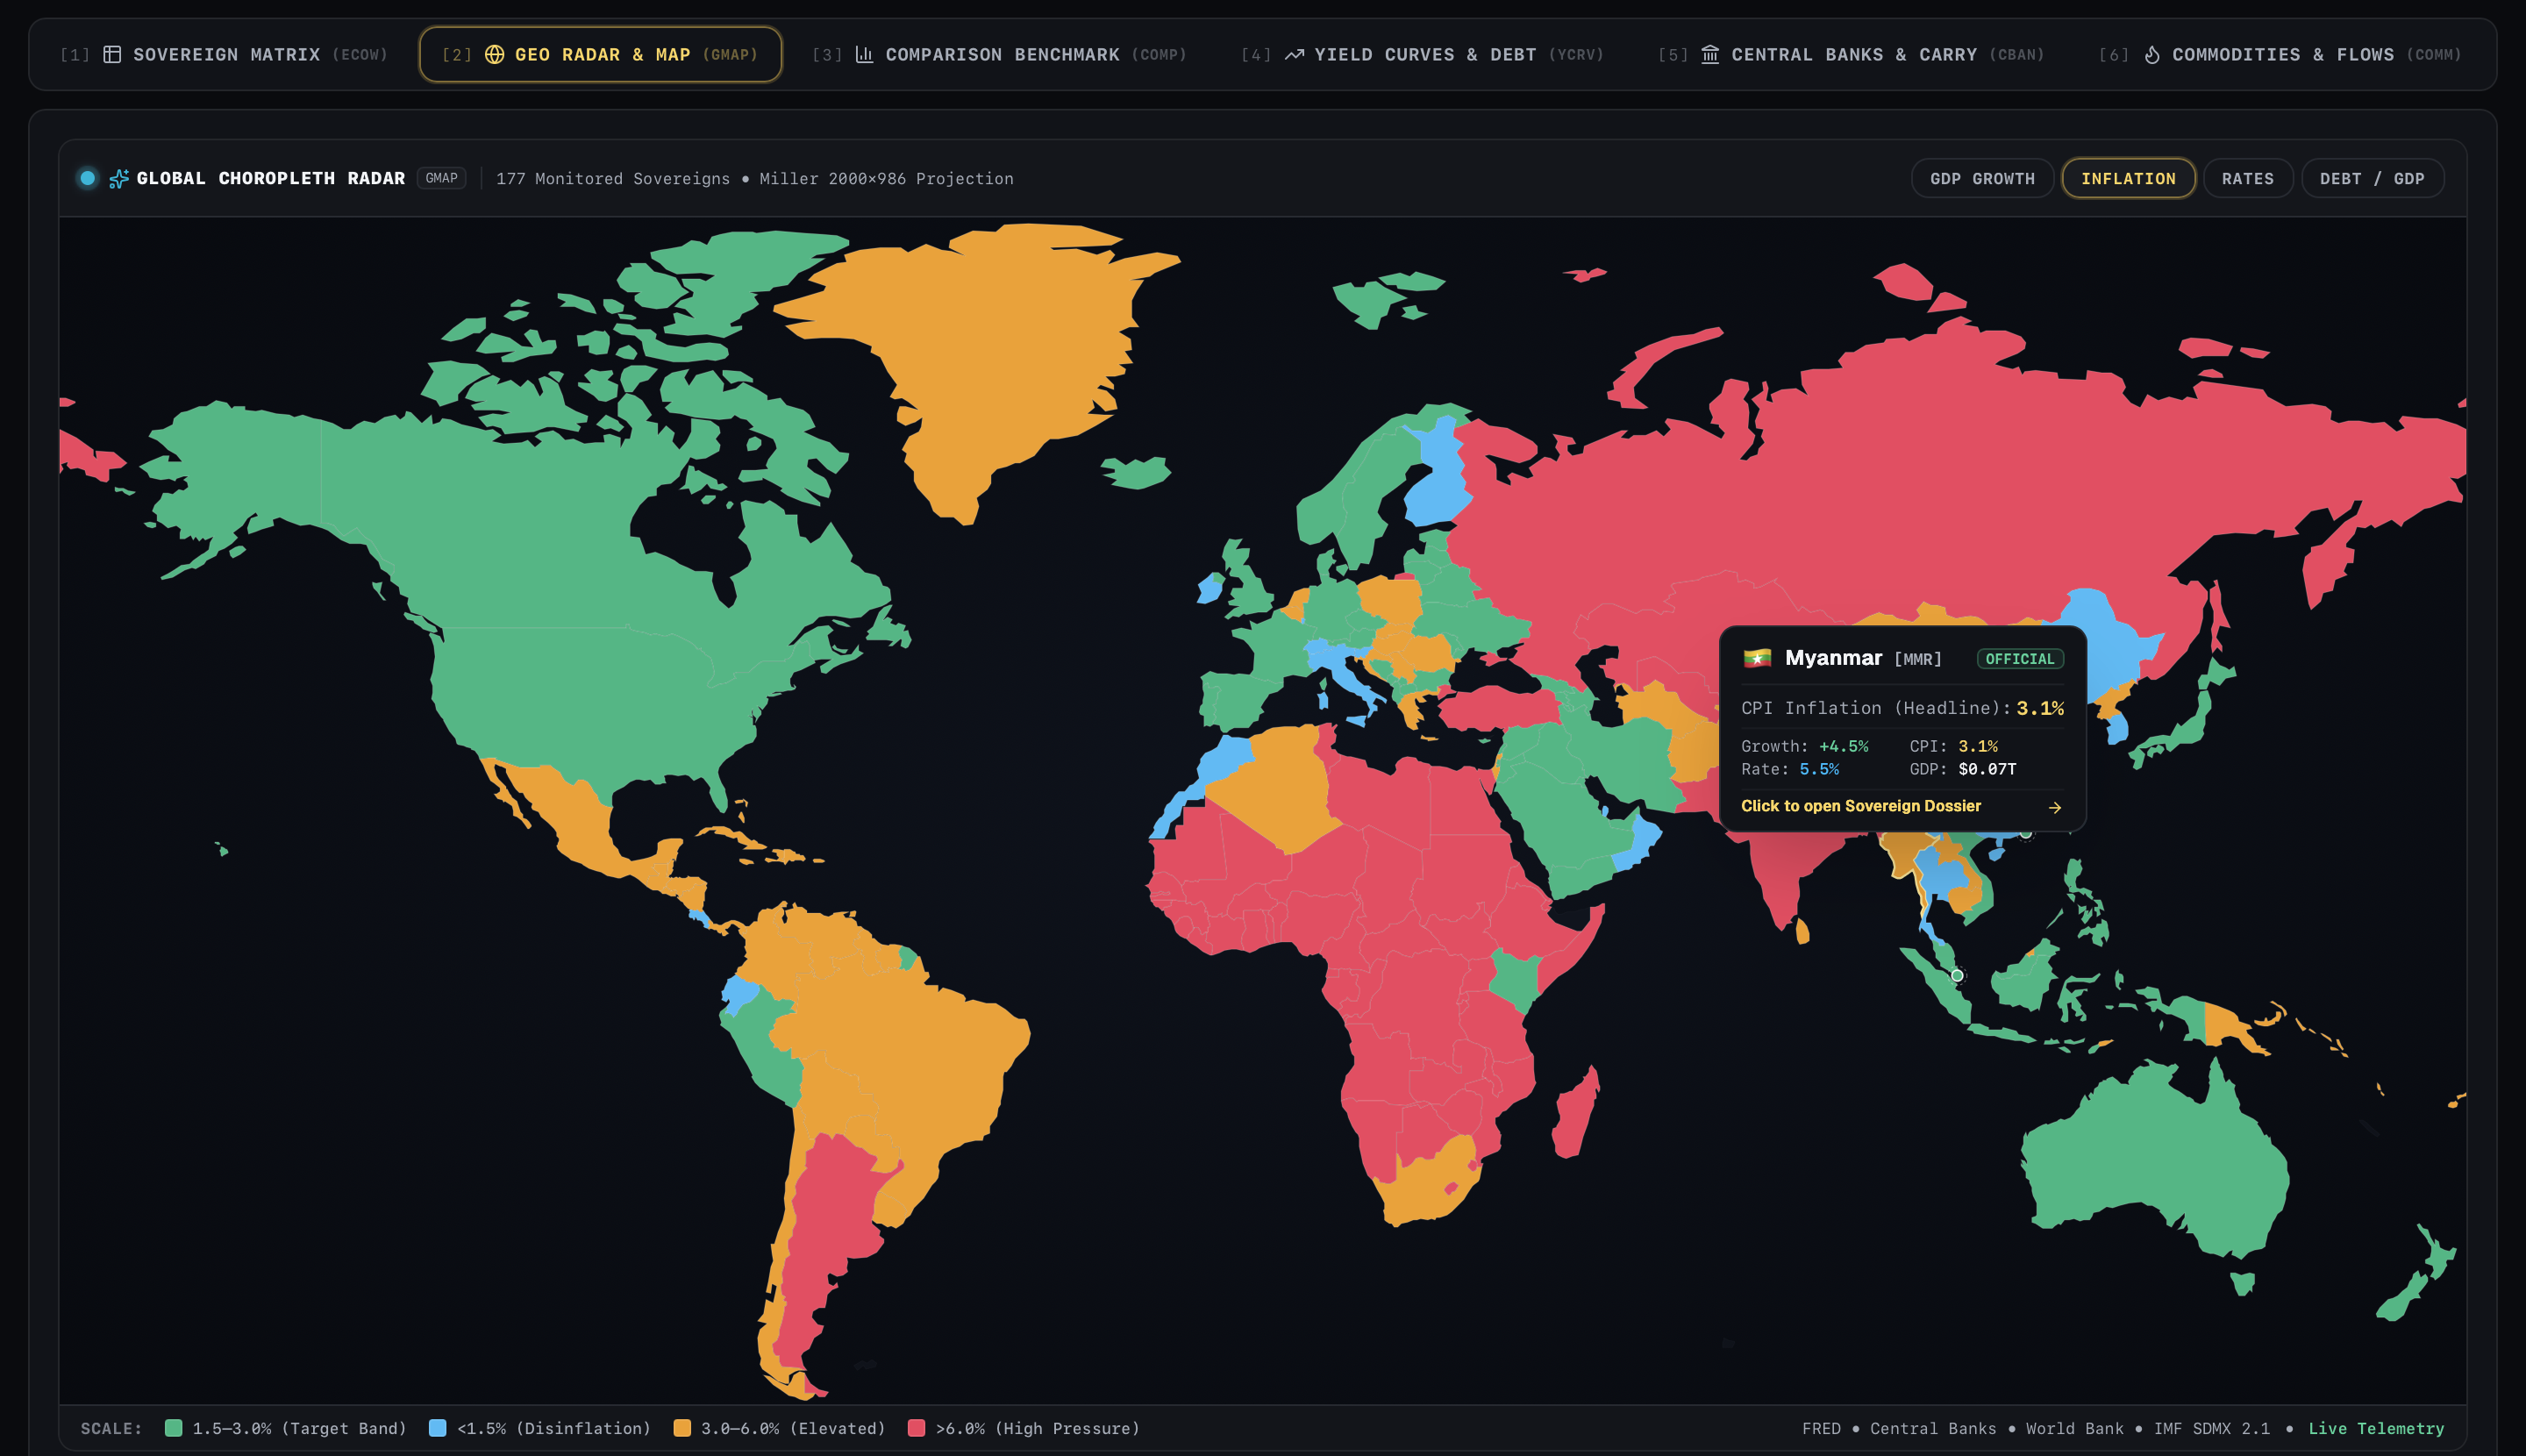
Economic conditions look different depending on where you are in the world.
The interactive world map provides a geographic view of macroeconomic dispersion, helping users explore how indicators such as inflation, growth, and monetary conditions vary across economies.
Instead of treating a country as another row in a table, the map makes its position within the global picture easier to understand.
COMP — Comparison Benchmark
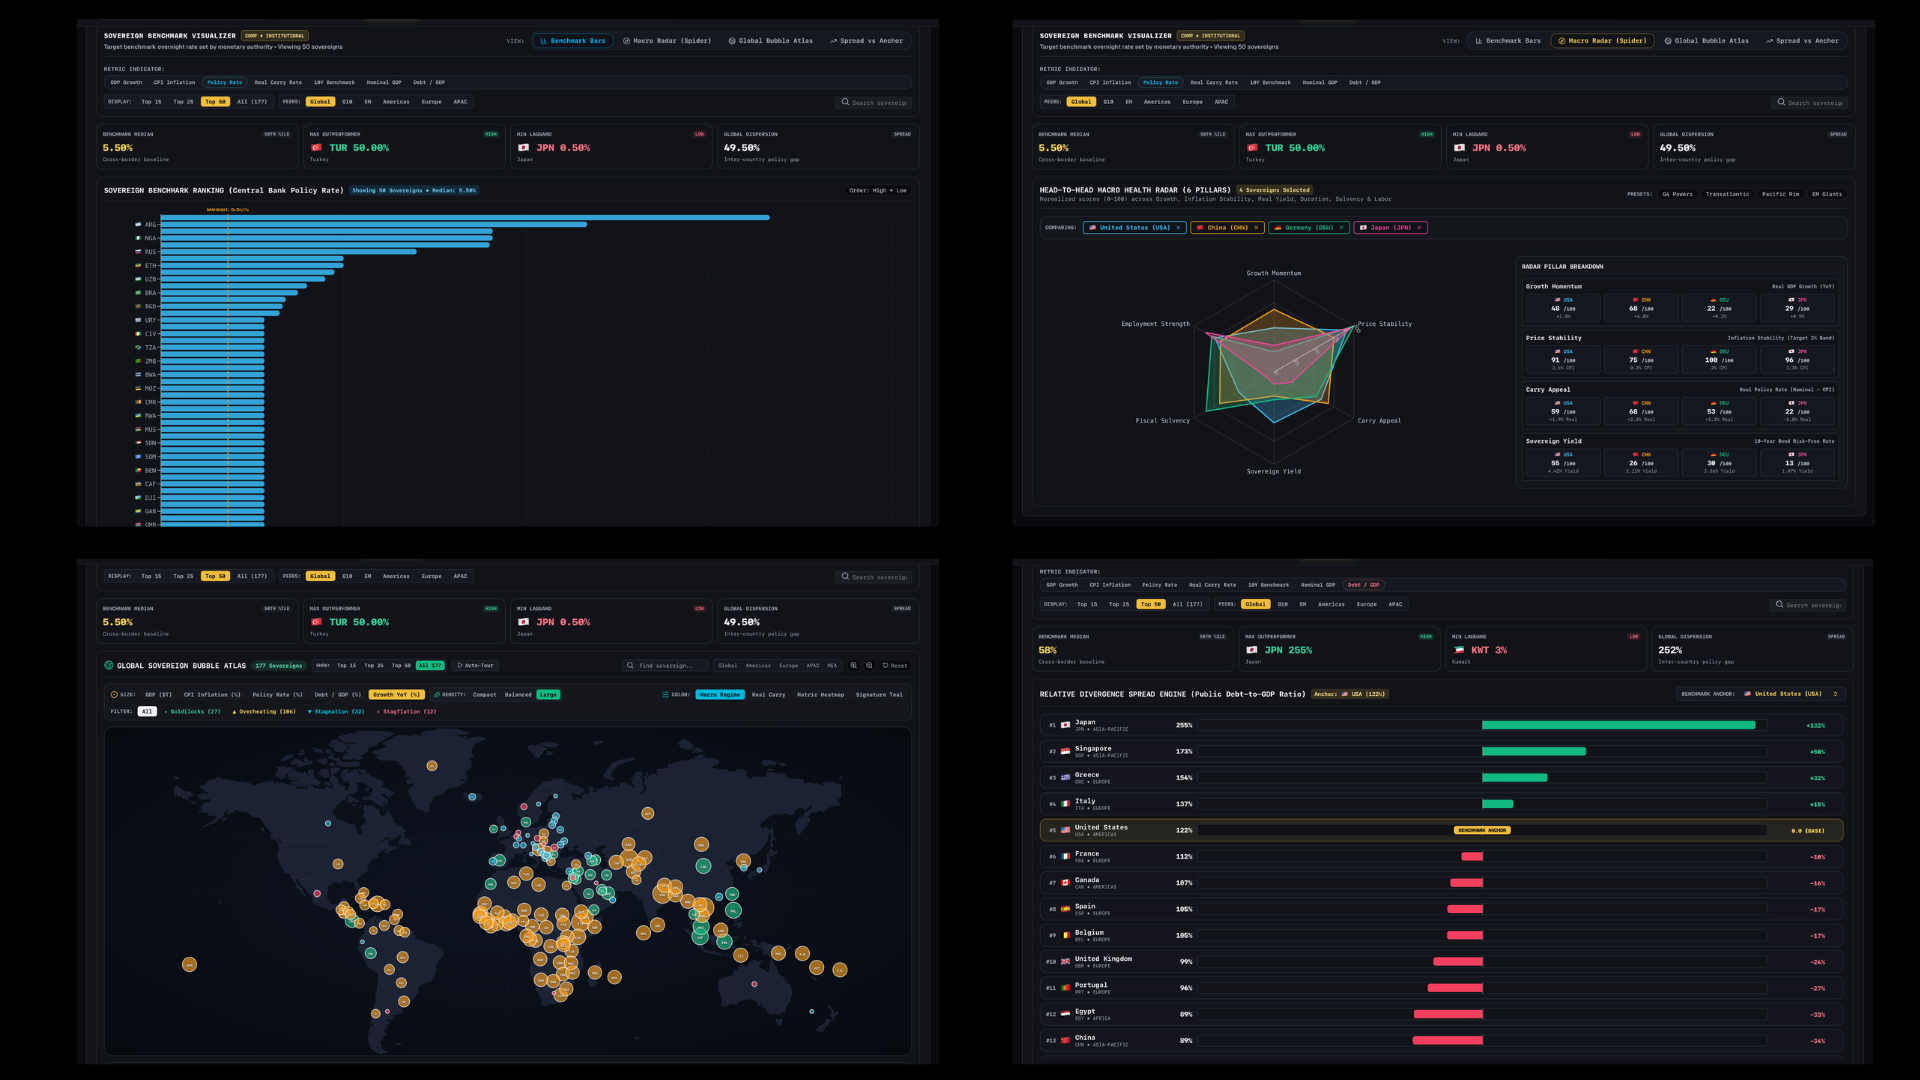
Comparing two countries should be more than reading numbers side by side.
The Comparison Benchmark includes four visualization modes:
Benchmark Bars: Rank economies by selected indicators.
Macro Radar: Compare multiple economic dimensions across countries.
Global Bubble Atlas: Explore relationships between economic variables through proportional bubbles.
Spread vs Anchor: See how a country's selected indicator differs from a reference economy or peer median.
Choose a metric, select a comparison group, and explore the differences visually.
YCRV — Yield Curves & Debt
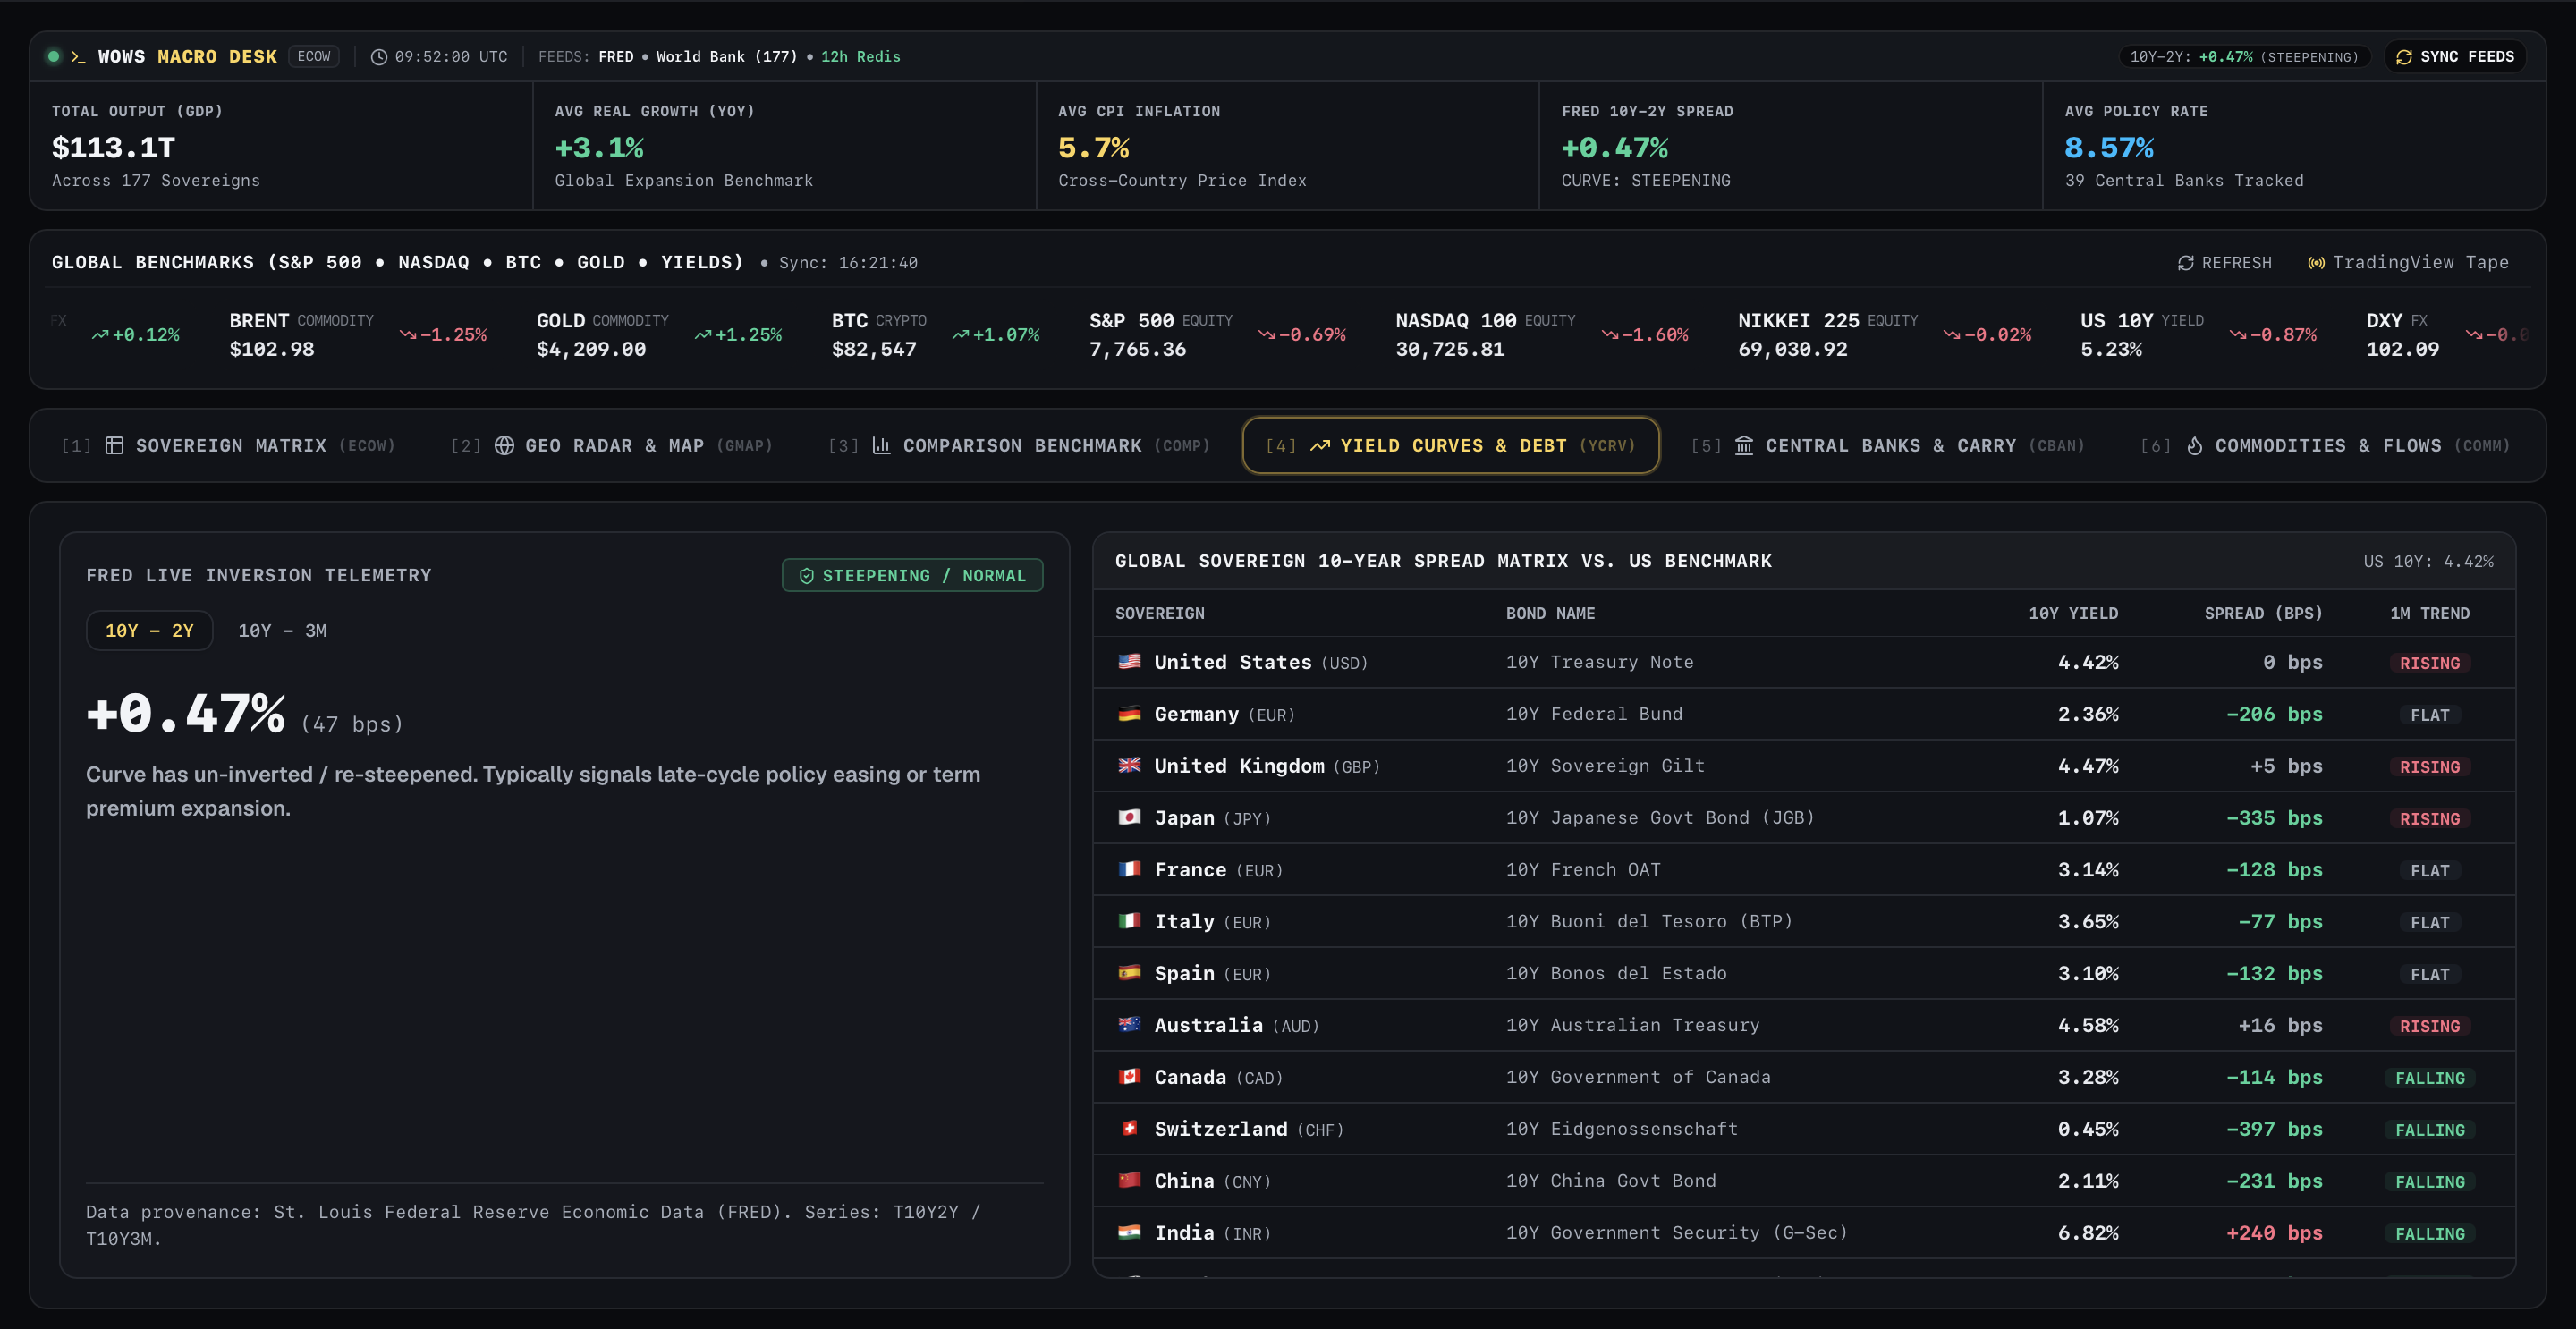
Bond markets provide a different view of economic expectations.
The Yield Curves & Debt workspace brings sovereign yields and curve spreads into the macro workflow, including the US Treasury 10-year minus 2-year spread.
It helps users examine the shape of yield curves, compare sovereign borrowing conditions, and follow changes in the relationship between short- and long-term rates.
CBAN — Central Banks & Carry
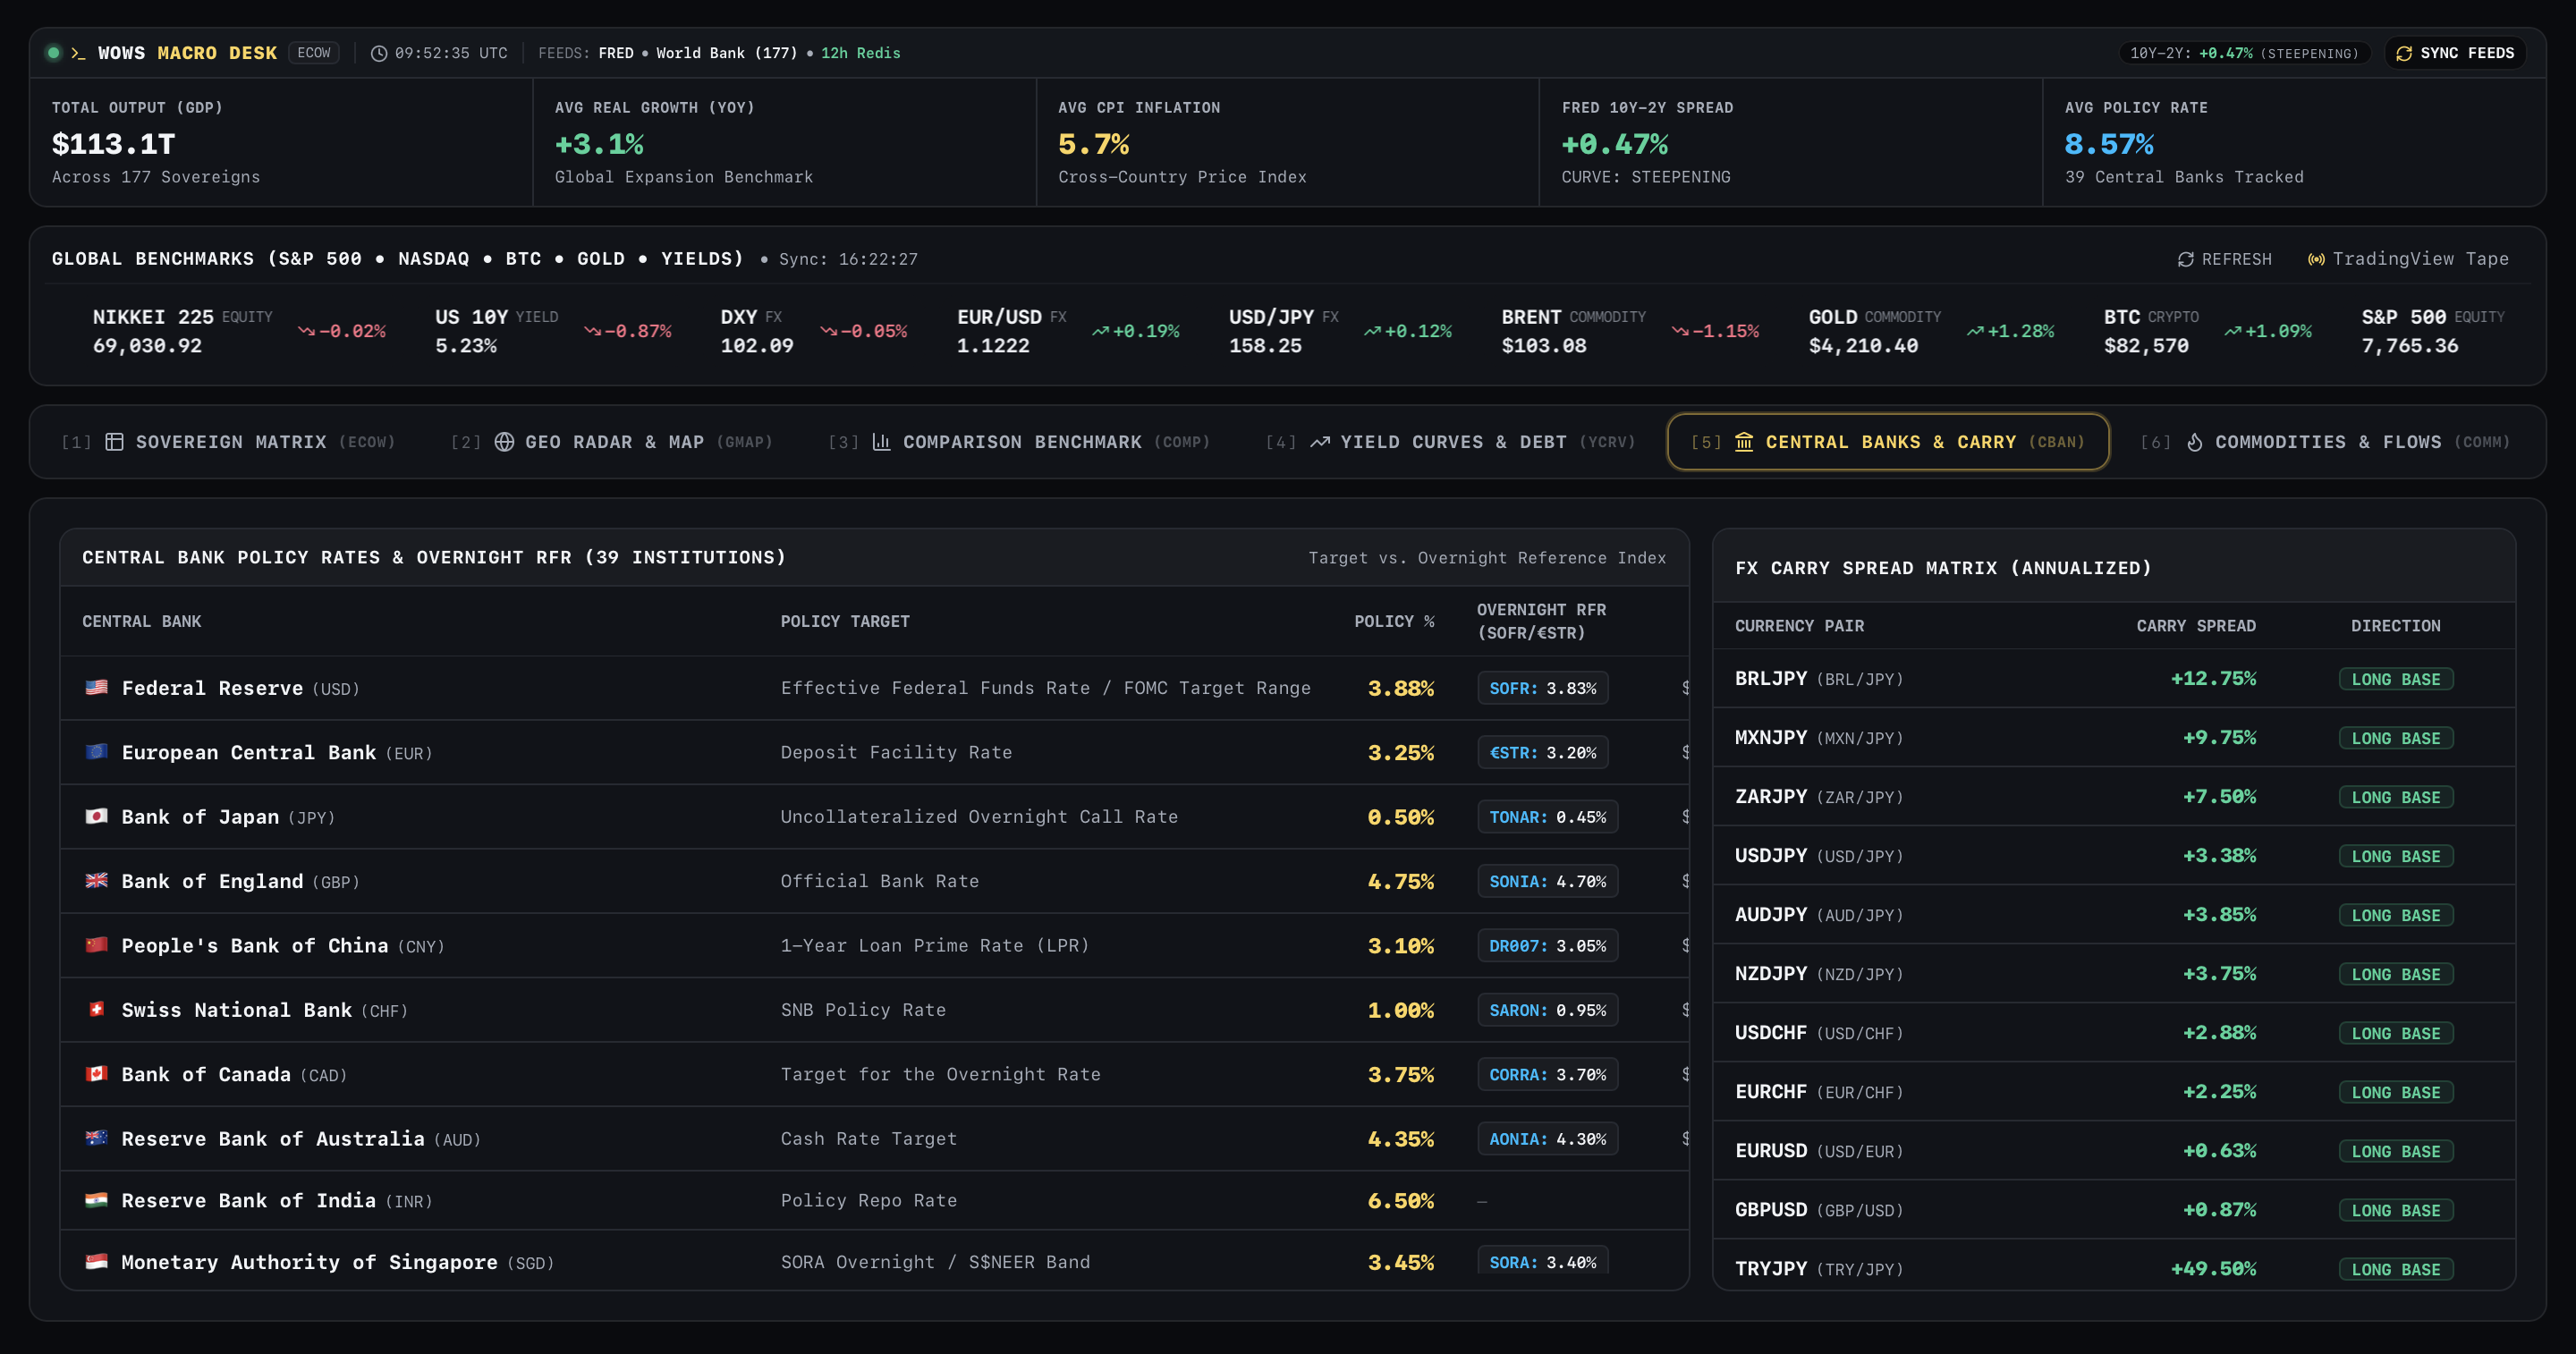
Monetary policy rarely stops at national borders.
Compare tracked central-bank policy rates, review monetary-policy positions, and examine interest-rate differentials across currencies.
When one central bank tightens while another eases, the resulting divergence can influence currency valuations and the economics of carry trades. CBAN brings those relationships into view.
COMM — Commodities & Strategic Flows
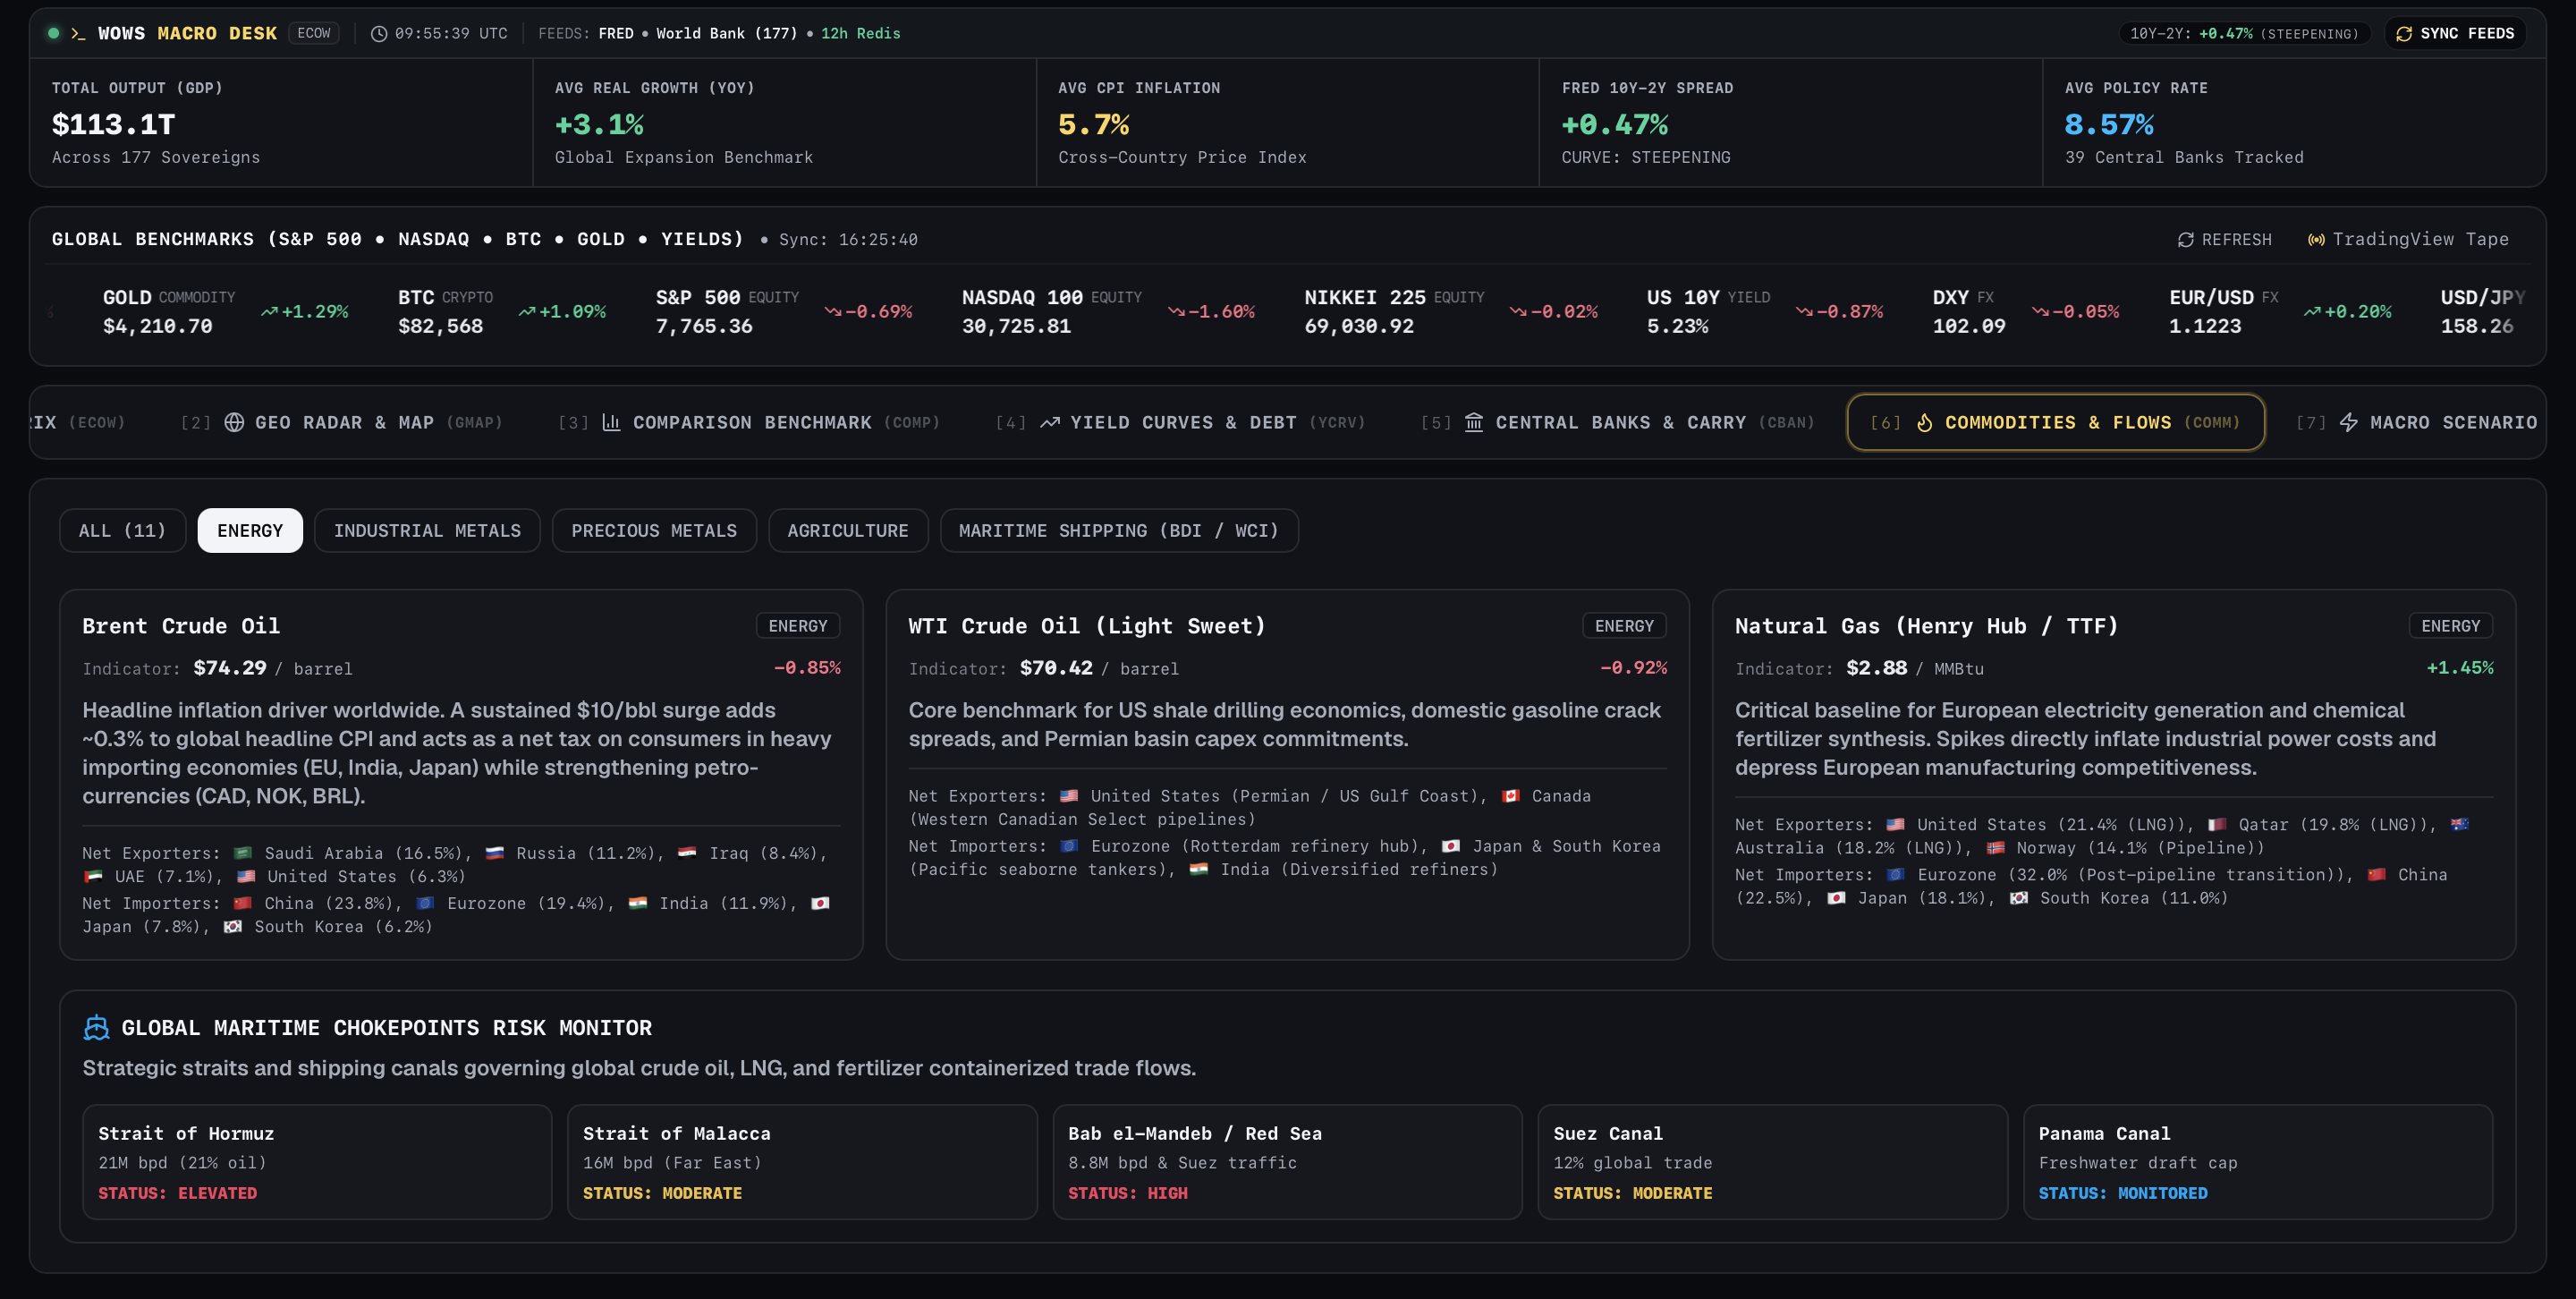
Commodities connect the financial system to the physical economy.
Energy supply, trade dependencies, shipping routes, and maritime chokepoints can all influence costs and inflationary pressures.
COMM brings commodity relationships and strategic trade flows into a dedicated workspace for exploring how physical supply networks connect to global markets.
SCEN — Macro Scenario Lab
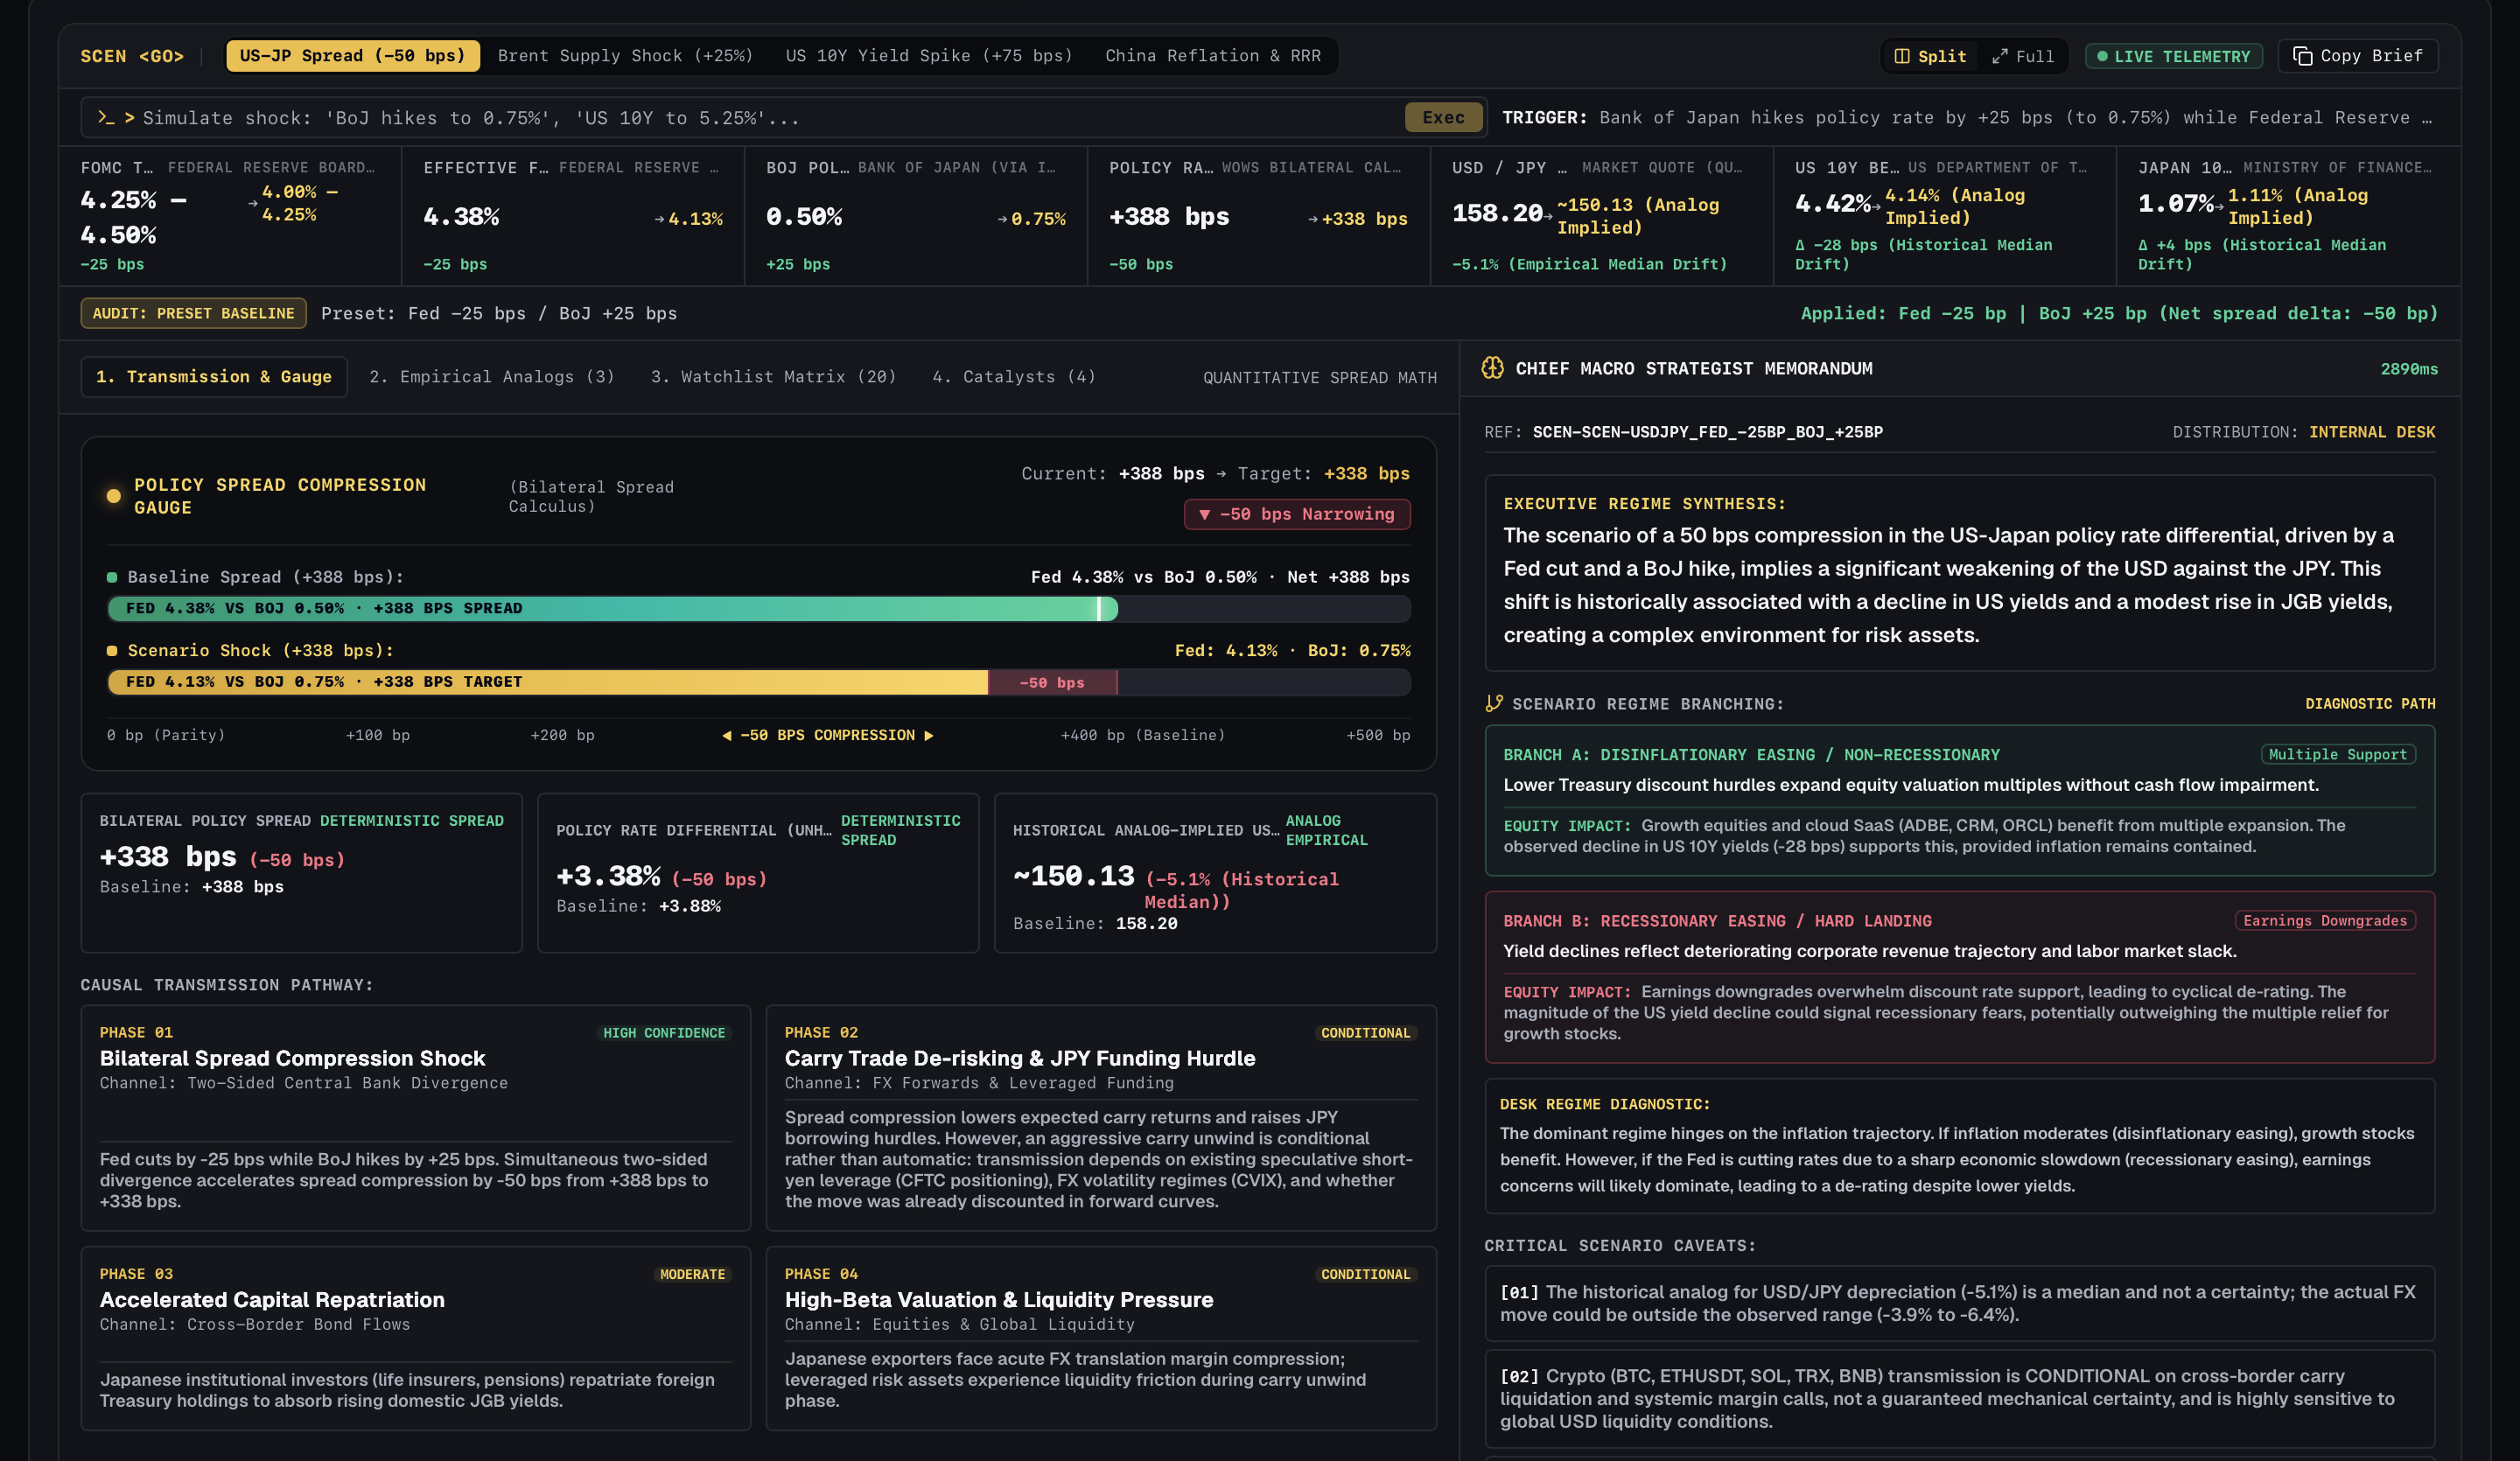
What happens when the Federal Reserve cuts rates while the Bank of Japan tightens?
The Macro Scenario Lab lets users explore hypothetical economic shocks through calculated changes, causal transmission pathways, and selected historical episodes.
WOWS calculates the relevant scenario deltas and maps potential effects across rates, currencies, bonds, and asset exposures. Historical analogs provide context, while conditionality and caveats help distinguish plausible mechanisms from guaranteed outcomes.
AI-supported reasoning sits alongside the calculations to explain what the results may mean—not replace the underlying data or turn a hypothetical scenario into a prediction.
CALN — Economic Calendar
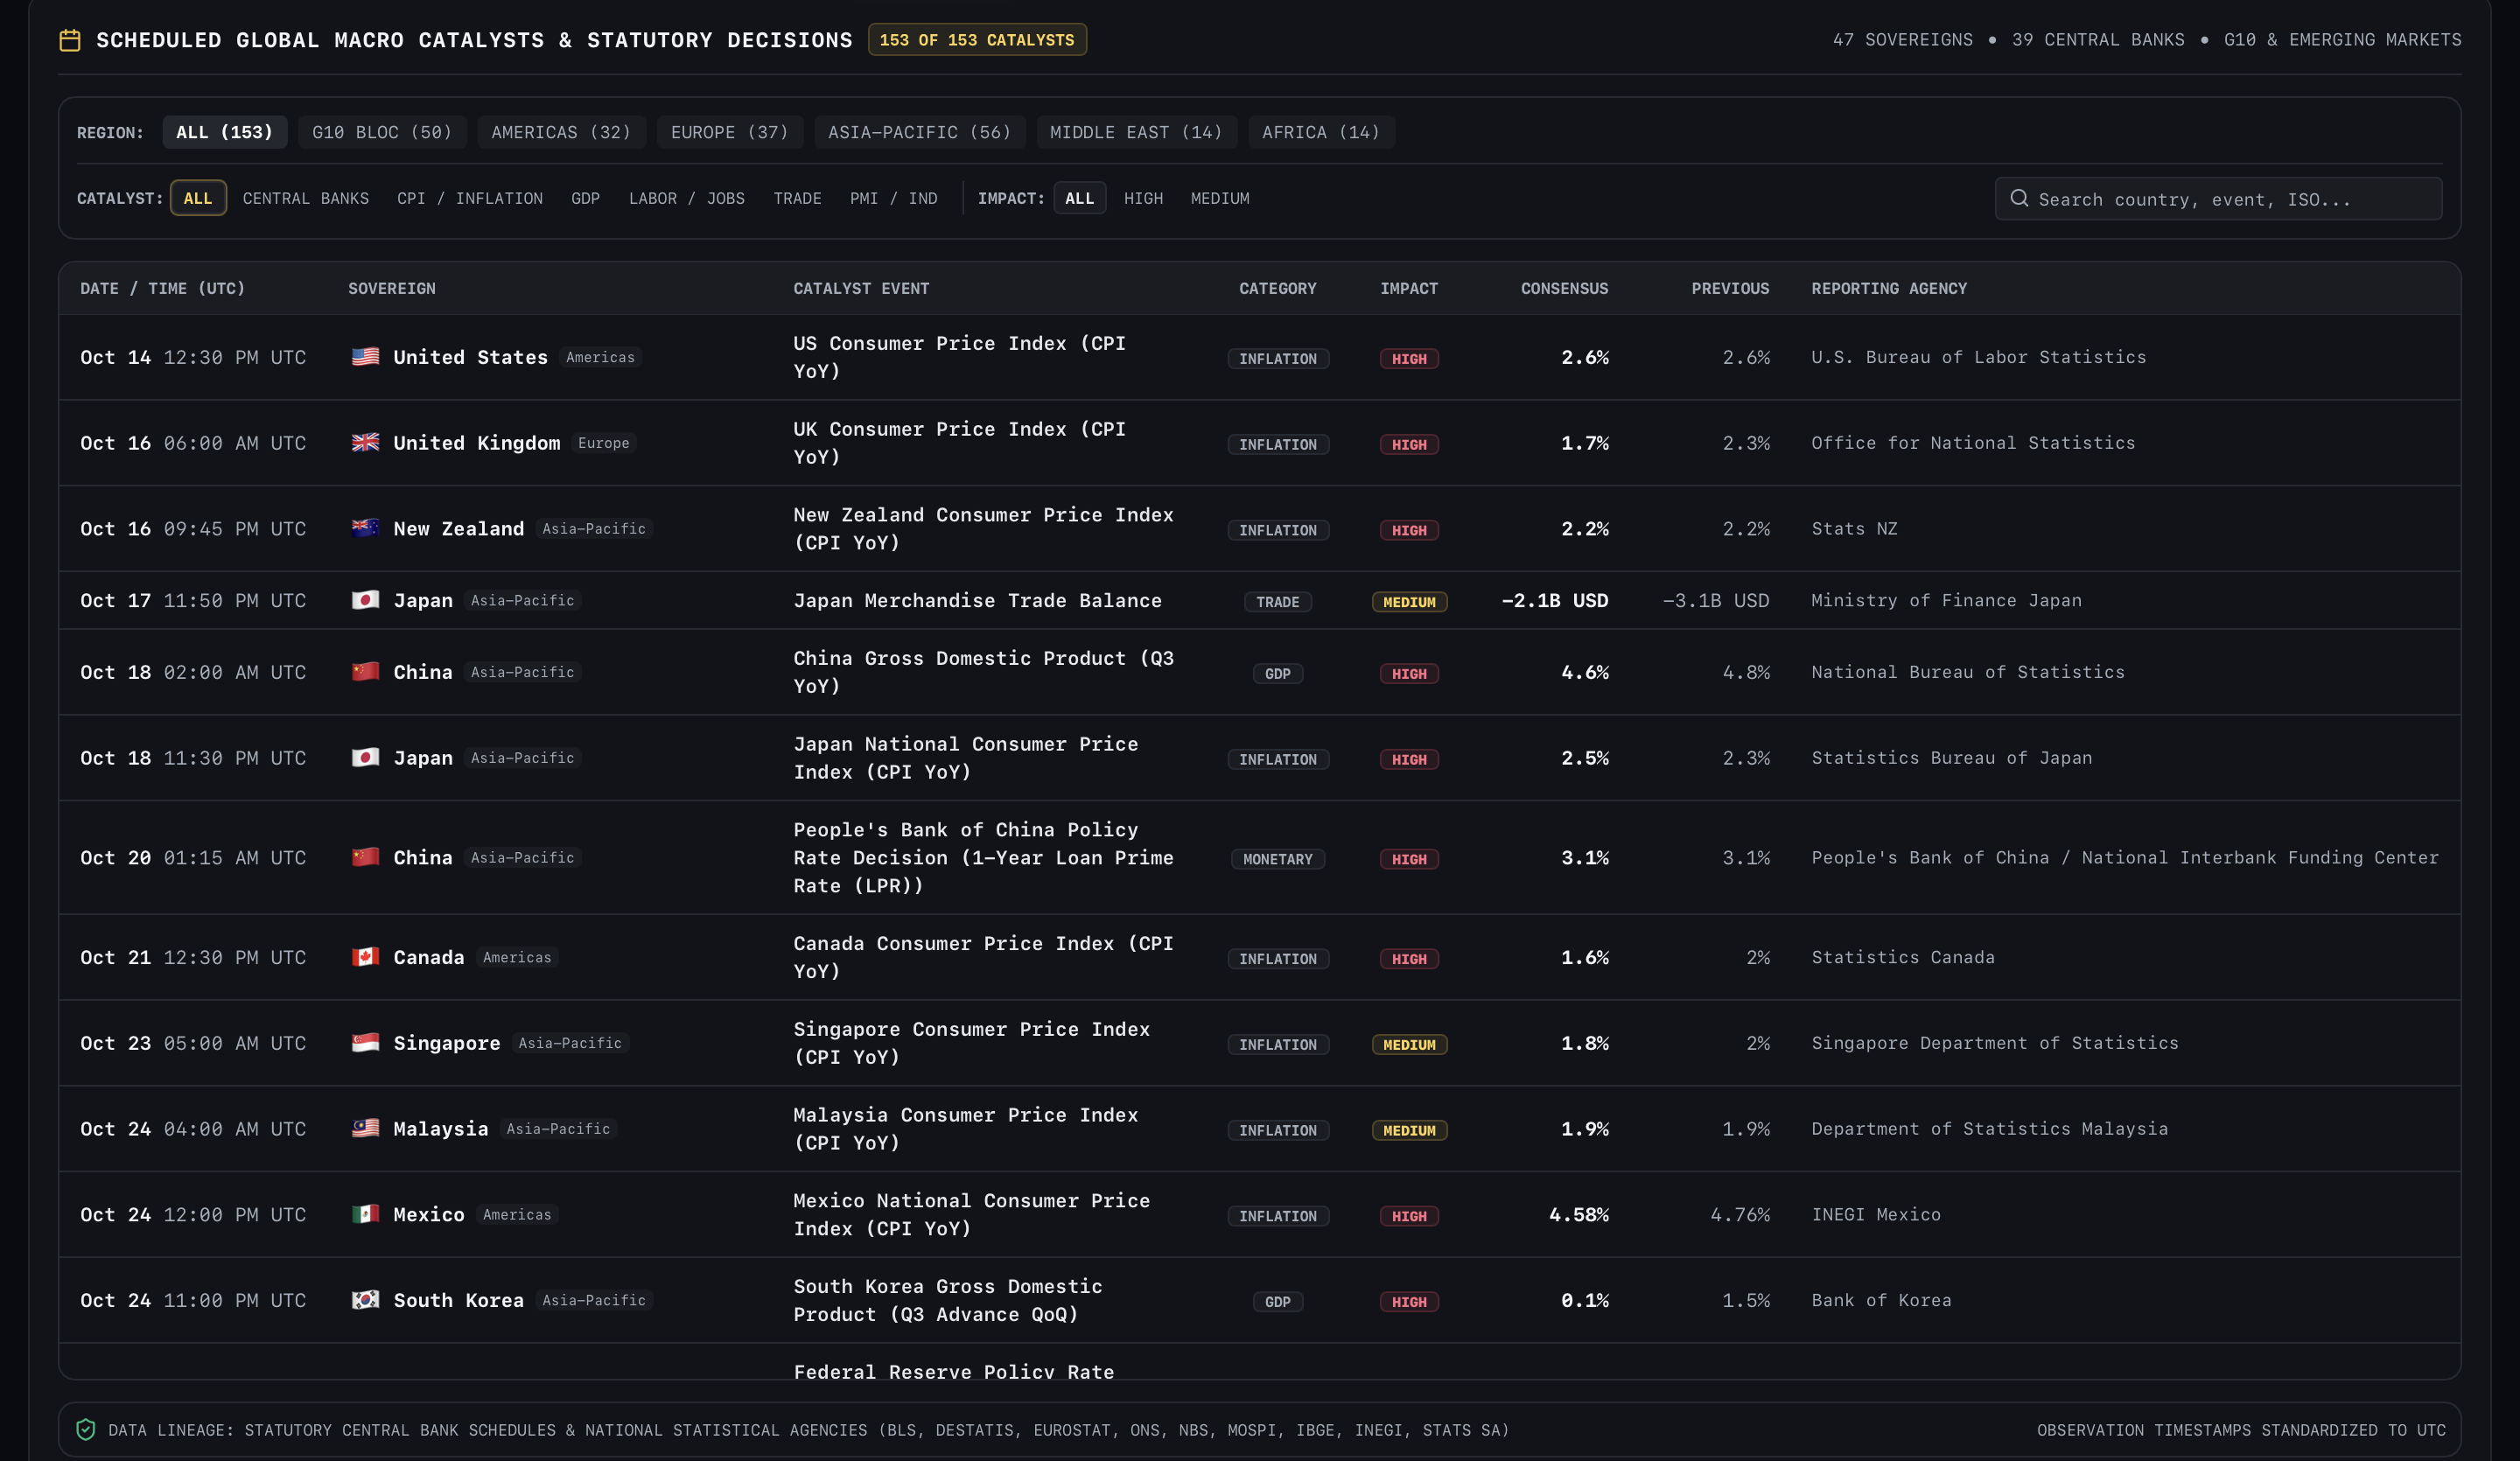
Economic releases and central-bank decisions are important checkpoints for any macro view.
The Economic Calendar provides a dedicated place to follow scheduled releases and policy events, helping users connect the indicators they monitor with the announcements that may change them.
Together, these eight workspaces form a connected environment for exploring the global macro picture.
Visual comparison, not another wall of numbers
The World Macro Desk is designed around exploration.
A heatmap can reveal where conditions differ. A benchmark chart can expose an outlier. A yield spread can show how two markets diverge. A country-level view can provide more context than a single global average.
Different visualizations answer different questions. Putting them in one workspace makes it easier to move between those questions without rebuilding the research process each time.
The result is a macro desk designed to make complex economic relationships more accessible without removing the underlying detail.
Designed for the screen you're using
A global macro desk shouldn't become difficult to use the moment you leave your desk.
The WOWS World Macro Desk has been designed to work across desktop, tablet, and mobile, so you can explore economic conditions wherever you happen to be.
On a phone, the layout makes better use of the available screen space. Navigation is easier to tap, comparison controls are arranged for smaller displays, and visual indicators have room to remain clear instead of getting lost in a cramped layout.
On desktop, the wider workspace and familiar rounded panels remain intact.
The idea isn't to make every screen look the same. It's to make the same macro information useful, whether you're exploring it on a large monitor or checking a few indicators on your phone.
Bringing the world's economic data together
Understanding the global economy means looking beyond a single market or country.
The WOWS World Macro Desk brings together economic data from sources including FRED, the World Bank, the IMF, and central banks, making it easier to compare countries and explore the relationships between growth, inflation, interest rates, and sovereign debt.
Of course, not every economic indicator moves at the same pace. Market yields can change throughout the day, while GDP and inflation figures arrive according to official release schedules. WOWS works with the latest available readings from its sources, with freshness depending on the indicator.
And because economic data isn't always available on demand, the desk is designed to retain reference information when an external source becomes temporarily unavailable.
The result is a broader view of the economy in one place — with less time spent jumping between sources and more time exploring what the numbers actually mean.
The bigger picture belongs in the same terminal
WOWS already brings together charts, market discovery, watchlists, alerts, news, and risk-free paper trading.
The World Macro Desk adds another layer: the ability to explore the economic conditions and cross-market relationships surrounding individual assets.
A currency pair is connected to interest-rate differentials. An equity market is connected to earnings expectations, borrowing costs, and capital flows. Commodity prices can influence inflation, trade balances, and monetary policy.
Understanding those connections does not guarantee better decisions. But it gives market analysis a broader context than price movement alone.
The WOWS World Macro Desk is now available.
Explore the global macro picture → https://woww.tech/economy
WOWS is an educational market analysis terminal and risk-free trading simulator. Market data may be delayed, and economic indicators may be revised. Scenario Lab outputs are conditional analytical exercises, not guaranteed forecasts or investment recommendations. Nothing on WOWS constitutes investment, financial, legal, or tax advice.